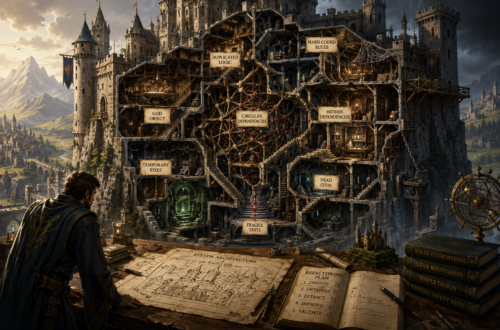

Seeing Through the Crystal Ball: Observability Beyond Monitoring
A wise ruler never governs a kingdom they cannot see.
Software architecture reaches an interesting stage after the obvious problems have been solved. The application survives deployments without drama, customers depend upon it every day, and the engineering team gradually shifts its attention from building features to operating a growing platform. Confidence naturally follows that maturity because the system appears stable, the infrastructure scales predictably, and production incidents become increasingly uncommon. Then, almost without warning, engineers begin encountering problems that refuse to fit neatly into familiar patterns. A handful of users report intermittent failures that nobody can reproduce. Response times drift upward despite healthy infrastructure metrics. A background process occasionally vanishes without leaving behind an obvious error. Every dashboard suggests that the system is functioning normally, yet seasoned developers recognize that appearances can be remarkably deceptive.
The instinctive response is almost always to collect more information. New dashboards appear beside existing ones, additional metrics are recorded, log retention periods are extended, and alerts multiply until nearly every operational characteristic has a corresponding graph or notification. For a brief period, this creates a comforting illusion of control because the organization possesses more data than ever before. Unfortunately, the first major production incident exposes the weakness in that assumption. Engineers gather around monitors displaying hundreds of charts while asking surprisingly basic questions. Which request failed first? What changed immediately beforehand? Which dependency introduced the delay? How did a problem that appeared isolated spread across multiple services? The information exists somewhere within the sea of telemetry, but assembling it into a coherent explanation consumes precious time. That experience teaches one of the most valuable lessons in modern software engineering. Visibility alone does not produce understanding, and collecting measurements is not the same as understanding the system that produced them.
The Royal Observatory
Imagine ruling a kingdom that has prospered far beyond the walls of its original castle. New cities have emerged along distant rivers, mountain passes now support thriving trade routes, and once-isolated villages have become prosperous centers of commerce. Every morning, trusted advisors present carefully prepared reports describing the health of their individual domains. The treasurer reports healthy revenues, the royal engineers confirm that bridges remain structurally sound, the granaries report successful harvests, and the city guards describe peaceful streets throughout the realm. Every report is accurate, every messenger is honest, and every department fulfills its responsibilities with admirable discipline. From the throne room, the kingdom appears healthy because every piece of information independently supports that conclusion.
Then merchants from two distant provinces begin arriving days later than expected. Markets that once flourished now experience unpredictable shortages, neighboring towns complain of delayed supplies, and tax revenues slowly decline despite abundant harvests. None of the royal reports explain why these changes are occurring because each advisor observes only a single portion of the kingdom. The bridge inspectors know nothing about caravan schedules, the treasurer cannot see washed-out mountain roads, and the harbor master has no knowledge of problems occurring hundreds of miles inland. Eventually, the ruler realizes that the kingdom suffers from neither poor administration nor insufficient information. It suffers from a fragmented perspective. The observatory is not valuable because it counts every star in the sky. It is valuable because it reveals relationships that remain invisible when every point of light is examined in isolation. Wisdom begins when individual observations become a connected story.
When the Kingdom Outgrows the Castle
Early software systems resembled those smaller kingdoms. A single application accepted requests, communicated with one database, generated responses, and completed nearly all of its work within the boundaries of one server or one tightly coupled deployment. Monitoring such an environment was comparatively straightforward because infrastructure health closely reflected application health. If processor utilization became excessive, memory was exhausted, or the database became unavailable, engineers could usually identify the root cause within minutes. Most failures occurred inside the castle walls, and investigating them rarely required looking beyond the boundaries of a single application.
Today’s distributed architectures bear little resemblance to that simpler world. A customer request may enter through an API gateway before visiting an authentication service, consulting a distributed cache, querying several databases, publishing events to a message broker, invoking asynchronous workers, contacting third-party payment providers, updating search indexes, and generating notifications before finally returning a response. Every participating service may report healthy processor utilization, acceptable memory consumption, and stable infrastructure metrics, even as the customer still experiences delays or failures. The architecture has evolved from a single fortress into an interconnected kingdom whose roads matter just as much as its buildings. Understanding that kingdom requires observing how requests travel between its cities rather than merely confirming that each individual city appears healthy from a distance.
Monitoring Is the Alarm. Observability Is the Investigation.
This distinction marks one of the most significant shifts in architectural thinking over the past decade. Monitoring answers questions that engineers already know to ask. It reports when processor utilization exceeds a threshold, when storage approaches capacity, when response times exceed established objectives, or when error rates spike. Those capabilities remain essential because reliable alerts allow teams to recognize developing problems before customers experience widespread disruption. Well-designed monitoring systems provide the early warning signals that every production environment requires, and no mature engineering organization would willingly operate without them.
Observability begins where those predefined questions end. Instead of asking whether a measurement crossed an expected boundary, it asks whether the system can explain behavior that nobody anticipated. Imagine a checkout service whose average response time remains comfortably below 200 milliseconds, while 1% of customers occasionally wait 15 seconds to complete a purchase. Traditional monitoring may never raise an alarm because the averages remain healthy and overall infrastructure utilization appears normal. Customers, however, experience a very different reality. Observability investigates the journey rather than the summary. It reconstructs how an individual request moved through every participating service, where delays accumulated, which dependency unexpectedly retried an operation, and how several healthy components combined to create an unhealthy experience. Architecture is judged twice: once when software succeeds, and again when engineers must explain why it failed. Systems rarely fail in average ways. They fail at the intersections where independently healthy components begin interacting in unexpected ways.
Designing for Questions Nobody Has Asked Yet
One production incident from early in my career permanently changed how I think about observability. A customer-facing application began experiencing intermittent delays shortly after an otherwise routine deployment. Every dashboard appeared reassuring. Processor utilization remained low, database performance was excellent, memory consumption was stable, and network traffic showed no obvious abnormalities. For nearly an hour, our team investigated infrastructure that was behaving exactly as designed because those were the measurements available to us. Only after tracing a handful of affected requests did we discover that an external authentication dependency had begun retrying failed connections after a subtle DNS change. None of our traditional metrics identified the problem because every individual component remained technically healthy. The architecture itself revealed the answer only after we stopped looking at isolated measurements and began following the complete journey of a request.
I have carried that lesson into every system I have helped design since then. Observability is not a collection of dashboards that engineers add after software reaches production, nor is it a luxury reserved for organizations operating at massive scale. It is an architectural characteristic that determines whether future engineers will inherit a system capable of explaining itself under pressure. Every meaningful log entry, carefully chosen metric, and propagated trace identifier represents an investment in future understanding. The goal is not to predict every possible failure because no architecture can accomplish that task. The goal is to ensure that when unfamiliar behavior inevitably appears, the system provides sufficient evidence for thoughtful engineers to understand what happened rather than relying on educated guesses. That is the true purpose of the kingdom’s crystal ball. It does not predict the future. It allows wise rulers to see the kingdom clearly enough to govern it well.
The Three Watchtowers of the Realm
Every well-governed kingdom depends upon many watchtowers, yet no wise ruler mistakes one tower’s view for the entire truth. A lookout stationed on the western cliffs may detect approaching ships days before they reach the harbor, while a ranger patrolling the northern forests notices damaged roads that no sailor could ever see. Merchants crossing the southern trade routes observe changing market conditions long before they appear in the royal treasury, and engineers inspecting bridges often discover structural weaknesses invisible from the castle walls. None of these observers is wrong. Each simply possesses a different perspective. Modern observability follows exactly the same philosophy. Metrics, logs, and distributed traces are not competing technologies but complementary viewpoints, each revealing information the others cannot. The strength of an observability strategy comes not from collecting more telemetry than everyone else, but from combining these perspectives into a single, coherent understanding of how the system behaves.
Metrics provide the broad view that every engineering organization relies upon. They quantify the health of the system by measuring request throughput, latency distributions, cache efficiency, queue depths, error rates, resource utilization, and countless other operational characteristics. Trends that would remain invisible during individual requests become immediately apparent when viewed over minutes, hours, or weeks. Metrics answer questions such as whether today’s deployment increased response times, whether traffic patterns changed after a marketing campaign, or whether infrastructure capacity continues to keep pace with customer demand. They are exceptional at revealing that something unusual has begun occurring, but they rarely explain why it happened. Much like a royal census, metrics describe the condition of the kingdom without recounting the individual stories that produced those numbers.
Logs preserve those stories. Every meaningful log entry captures a specific event that occurred while the software performed useful work, allowing engineers to reconstruct individual moments that collectively produced the broader trends visible within metrics. Unfortunately, many applications generate enormous quantities of logs while communicating remarkably little. Endless records announcing successful function calls or completed database connections consume storage without improving understanding. Effective logging emphasizes context rather than volume. It records meaningful business events, important state changes, unexpected conditions, correlation identifiers, and enough surrounding information for future investigators to understand what the application was attempting to accomplish. Good logs become less like a machine diary and more like the journal of an experienced royal scribe who understands which details historians will someday consider important.
Distributed traces complete the picture by following a single request throughout its entire journey across the architecture. Instead of treating every application as an isolated destination, tracing records how work moves from one service to another, preserving timing information and relationships that disappear when each component is viewed in isolation. Authentication, authorization, database queries, cache lookups, message queues, background workers, third-party integrations, and notification services all become chapters within the same story. During production incidents, traces often reveal where latency accumulated, where retries unexpectedly occurred, or where a single dependency quietly introduced delays that cascaded through the rest of the request. Veteran architects stop asking which server appears unhealthy and begin asking which part of the journey prevented the customer from reaching the destination.
Teaching the Kingdom to Speak
One characteristic consistently distinguishes mature engineering organizations from those that struggle during production incidents. Thoughtful teams deliberately design software that explains itself. They assume today’s architecture will eventually surprise tomorrow’s engineers, so they build applications that can communicate meaningful information when those surprises occur. This philosophy influences far more than operational tooling. It shapes application design, interface boundaries, naming conventions, and even the structure of business workflows. Observability becomes less about collecting telemetry and more about creating software that remains understandable years after the original developers have moved on.
Logging provides an excellent example of this principle. Consider an order-processing service responsible for validating payments, reserving inventory, and initiating shipment. A straightforward implementation might simply record that processing began and was eventually completed. Technically, nothing is wrong with those log messages. They confirm that work occurred and provide timestamps for later analysis. During a production incident, however, they leave investigators asking countless additional questions because the software documented activity without preserving the surrounding context that explains the business operation itself.
</> Java

logger.info("Processing order {}", orderId);

paymentService.authorize(order);
inventoryService.reserve(order);
shippingService.schedule(order);

logger.info("Order {} completed successfully", orderId);
Imagine that customers begin reporting duplicate shipments shortly after a deployment. The code above confirms that an order entered the workflow and was eventually completed, but it says remarkably little about the journey itself. Which warehouse fulfilled the request? Which payment processor handled authorization? Did the inventory reservation succeed before shipment began? Was the operation retried because a downstream dependency timed out? Did this request belong to a larger batch operation affecting multiple customers? Engineers investigating the incident must reconstruct those answers from scattered evidence because the application never preserved the context that would have made the investigation straightforward.
A more mature implementation recognizes that logs exist primarily for the people who will maintain the software in the future. Rather than documenting isolated technical events, it records meaningful business context that explains not only what the application did, but why the work mattered.
</> Java

logger.atInfo()
      .addKeyValue("traceId", traceId)
      .addKeyValue("orderId", order.getId())
      .addKeyValue("customerId", order.getCustomerId())
      .addKeyValue("warehouse", warehouseId)
      .addKeyValue("paymentProvider", providerName)
      .log("Beginning order fulfillment workflow");
The same philosophy extends beyond logging. Correlation identifiers and distributed traces become valuable only when they travel with the request itself. If one service generates a trace identifier but downstream services fail to preserve it, the investigation ends halfway through. Well-designed systems therefore treat tracing as a shared architectural responsibility rather than an implementation detail owned by individual services.
</> Java

Span span = tracer.spanBuilder("ProcessOrder")
                  .setParent(parentContext)
                  .startSpan();

try (Scope scope = span.makeCurrent()) {
    paymentService.authorize(order);
    inventoryService.reserve(order);
    shippingService.schedule(order);
} finally {
    span.end();
}
This example is intentionally simple, yet it illustrates an important architectural principle. The code itself is less significant than the continuity it preserves. Every downstream service now participates in the same narrative, allowing engineers to reconstruct an individual request from beginning to end instead of piecing together disconnected fragments after an incident has already begun. The additional effort during development is measured in minutes. The time it can save during a production investigation is often measured in hours.
Following the Merchant Caravan
Consider a merchant caravan departing the capital with valuable supplies destined for a distant coastal city. Its journey crosses mountain passes, traverses several bridges, stops at customs checkpoints, passes through crowded marketplaces, and finally reaches the harbor where cargo transfers onto waiting ships. If the shipment arrives five days late, the ruler naturally asks where the delay occurred. Did flooding wash out a bridge? Were customs officials overwhelmed by unexpected traffic? Did a damaged wagon block a narrow mountain road? Or did favorable conditions everywhere except the harbor create a bottleneck that nobody anticipated? Without observing the entire journey, every explanation remains speculation because each individual location reports only its own conditions.
Customer requests travel through today’s distributed architectures in much the same way. A browser request may begin at an API gateway, proceed through authentication and authorization services, consult distributed caches, execute several database queries, invoke external payment providers, publish asynchronous events, and trigger multiple background workers before a response returns to the user. When customers experience delays, the true source often lies not within any single component but within the relationships between them. Distributed tracing allows engineers to follow the complete caravan instead of inspecting isolated checkpoints. More importantly, it transforms incident response from educated guesswork into evidence-based investigation. That change in mindset may be the greatest contribution observability makes to software architecture. Systems become easier to improve because engineers finally understand how their individual parts behave together rather than merely confirming that each part functions independently.
The Crystal Ball Is Only as Good as Its Vision
One misconception I occasionally encounter is the belief that adopting a sophisticated observability platform automatically produces better operational insight. Today’s tooling is remarkably capable, but no dashboard, tracing platform, or analytics engine can compensate for software that was never designed to communicate meaningful information. An elegant visualization cannot reveal context that was never recorded, and a distributed trace cannot reconstruct relationships that an application failed to preserve. Observability platforms amplify the quality of the signals we choose to produce. If those signals are incomplete, inconsistent, or disconnected from the business itself, even the most advanced tools simply present incomplete answers more beautifully. Technology can illuminate what exists, but it cannot invent evidence after the fact.
This realization fundamentally changes how mature architects think about instrumentation. Rather than treating telemetry as operational overhead, they view it as part of the application’s contract with the engineers who will someday maintain it. Every metric represents a question the team expects to ask. Every log entry preserves a decision the application made. Every trace tells the story of a customer’s experience as it moves through the architecture. Instrumentation therefore becomes part of software design rather than an activity postponed until deployment. The application is no longer built merely to execute business logic. It is built to explain that logic whenever production behaves differently than expected. Systems that can clearly explain themselves are easier to maintain, easier to improve, and significantly less intimidating during moments of uncertainty.
The First Hour of an Incident
Observability demonstrates its true value during the first hour of a production incident, when information is incomplete, pressure is increasing, and every minute without understanding affects both customers and the engineering team. Imagine an online retailer whose checkout process begins failing intermittently during a busy afternoon. Customer reports describe occasional timeouts, yet infrastructure dashboards continue to show healthy processor utilization, stable memory consumption, and normal network traffic. Traditional monitoring confirms that no servers have failed and no obvious capacity limits have been reached. Without additional context, engineers naturally begin investigating the healthiest parts of the system simply because they have no better evidence.
A mature observability strategy changes that investigation almost immediately. Metrics reveal that checkout latency has increased only for authenticated customers. Distributed traces show that every delayed request spends several additional seconds communicating with the authentication service before reaching the payment provider. Logs associated with those traces reveal repeated retries due to an outdated DNS record affecting only one regional authentication endpoint. No individual component appears unhealthy when viewed independently, yet the complete journey tells a remarkably clear story. Engineers correct the configuration, customer traffic returns to normal, and the incident concludes with confidence rather than uncertainty. The greatest lesson from situations like this is not that observability shortens incidents, although it often does. The greater lesson is that observability allows engineers to spend their time solving the right problem rather than merely searching for it.
This pattern repeats throughout every well-run engineering organization. Successful incident response depends less on heroic troubleshooting than on software that provides sufficient evidence to guide thoughtful investigation. The best teams are rarely those that never experience production problems. They are the teams whose systems make those problems understandable before frustration turns into speculation. Every incident should leave the architecture more capable of explaining itself than it was the day before, because every investigation uncovers another opportunity to improve the questions the software can answer. Every production incident asks the same question: Did the system merely fail, or did it teach us why?
Designing for the Unknown
Perhaps the greatest lesson observability teaches has very little to do with telemetry and everything to do with humility. Every engineer eventually discovers that production environments possess an extraordinary ability to surprise the people who designed them. Customer behavior evolves, infrastructure changes, third-party dependencies introduce subtle regressions, and new usage patterns emerge that nobody anticipated during development. These surprises do not necessarily reflect poor engineering. They simply remind us that complex systems continuously create interactions that exceed any individual’s ability to predict them completely.
Mature architects therefore stop trying to anticipate every possible failure and begin designing systems capable of explaining failures they never imagined. That distinction changes countless architectural decisions. Context is preserved across service boundaries because future investigations will depend upon it. Correlation identifiers travel with every request because isolated events rarely tell the complete story. Business operations are measured alongside technical performance because customers experience business outcomes rather than processor utilization. Every thoughtful decision increases the architecture’s ability to answer tomorrow’s unfamiliar questions. Good observability accepts that uncertainty cannot be eliminated, but insists that uncertainty can be investigated intelligently.
The kingdom’s observatory illustrates this philosophy perfectly. Wise rulers do not construct observatories because they already understand every movement of the heavens. They build them because the sky continually presents new patterns worthy of careful study. The crystal ball is not valuable because it predicts every future event. It is valuable because it allows the ruler to recognize relationships that would otherwise remain hidden. Observability serves precisely the same purpose within software architecture. It does not promise perfect foresight. It provides the clarity necessary to understand systems whose complexity has grown beyond any single person’s mental model.
The Greatest Kingdoms Understand Themselves
Throughout this week’s theme, Ruling the Realm, we have explored the responsibilities that emerge after a kingdom becomes too large to govern through intuition alone. Preparing for failure taught us that resilience begins long before disaster strikes. Observability extends that lesson by demonstrating that resilient systems must also explain themselves when unexpected events occur. Monitoring tells us that something deserves our attention. Observability reveals how the story unfolded, why individual components behaved as they did, and where meaningful improvements belong. Together they transform operational data from isolated measurements into a narrative that engineers can trust when every decision matters.
One sentence has remained with me throughout years of building and maintaining production systems. The most valuable software is not merely software that works. It is software that can explain why it worked, why it failed, and how it reached either outcome. That philosophy influences architecture long before the first production deployment because every meaningful investment in observability becomes an investment in future engineering judgment. Teams inherit systems that communicate clearly, investigations become disciplined rather than speculative, and operational confidence grows because evidence replaces assumption. The crystal ball ultimately succeeds not because it reveals the future, but because it removes the fog surrounding the present.
As we conclude this chapter of The Architect’s Grimoire, remember that every growing kingdom eventually reaches a point where wisdom depends upon visibility rather than instinct. The same is true of modern software systems. Mature engineering is measured not by the number of dashboards a team maintains, but by how quickly thoughtful engineers can understand unfamiliar behavior when it inevitably appears. Systems that explain themselves become easier to evolve, easier to maintain, and far more resilient throughout the years that follow.
On Wednesday, we will continue our journey through The Architect’s Grimoire with The Automated Kingdom: When Excellence Becomes Routine. A wise ruler first learns to see the kingdom clearly. Only then can the kingdom begin to govern itself. Observability provides understanding, but automation transforms that understanding into consistent action. The strongest engineering organizations eventually discover that excellence is rarely the result of heroic effort. It is the result of thoughtful systems that quietly perform the right work every single day.


You May Also Like

The Curse of Premature Fortification

Becoming the Royal Architect: Designing Systems That Outlive You